Marine science can feel huge when you only want to know how the ocean shapes climate. The short answer: the ocean covers most of the planet, soaks up heat and carbon, and moves both around, so understanding it explains much of climate change.
| Item | Value |
|---|---|
| Share of Earth’s surface covered by the ocean | Nearly 71% |
| Share of all water contained in the ocean | More than 97% |
| Ocean CO2 sink, decade 2012 to 2021 | 2.9 ± 0.4 GtC per year |
| Ocean share of total CO2 emissions, same decade | 26% |
The ocean-extent figures come from NOAA’s JetStream page on the ocean and the carbon figures from the Global Carbon Budget 2022. Figures can change as new data and new editions appear, so check the source before you rely on them.
What does marine science cover?
Marine science is the study of the ocean as a physical, chemical and living system. It brings together oceanography, marine biology, chemistry, geology and atmospheric science, because the ocean and the air above it exchange heat, water and gases all the time.
The scale explains why this matters for climate. According to NOAA, “nearly 71% of the Earth’s surface is covered by it and more than 97% of all our water is contained in it.” Any process that changes the ocean, even slightly, therefore acts on a very large share of the planet.
Researchers describe the ocean with a short list of measurements that tie together almost every topic on this site. In a NASA Earth Observatory feature on ocean productivity, for example, researchers “deployed sensors to measure dissolved oxygen and carbon, suspended particles, salinity, temperature, chlorophyll, and the amount of light available for photosynthesis.” Those variables map onto the main themes of the field:
- Temperature and salinity set water density and so drive currents and layering.
- Dissolved gases such as oxygen and carbon dioxide control chemistry and the habitat available for life.
- Chlorophyll and light reveal where microscopic algae are growing and how much energy they can capture.
- Carbon in particles and water shows how the ocean moves carbon between the surface and the deep.
This hub gives you the map. Each theme below ends with a pointer to a deeper guide, and the last section links to the applied side of the field.
How the ocean stores heat
The simplest way to think about the ocean’s climate role is as a giant heat store. NOAA’s Pacific Marine Environmental Laboratory (PMEL), summarising the 31st annual State of the Climate report published in August 2021, states that “the ocean absorbs more than 90 percent of Earth’s excess heat from global warming.” That one fact explains why the ocean has been called the planet’s buffer: most of the extra energy trapped by greenhouse gases ends up in the water, not in the air.
The same summary describes where the heat is going. It says “this record heat reflects the continuing accumulation of thermal energy in the top 2300 feet of the ocean,” and adds that “ocean heat content was also record high in a deeper layer beneath, from 700 to 2000 m depth.” Heat is not staying neatly at the surface, which matters for sea level, because warm water expands.
Scientists track this with a quantity called ocean heat content, the total thermal energy held in a column of water. Our guide to ocean heat content explains how it is measured and why it is a steadier climate signal than surface temperature alone.

Because the ocean stores so much heat, warming at the surface understates the change in the whole climate system. Air temperature records move up and down with short-term patterns such as El Niño, while the heat stored in the ocean keeps building. For that reason, many scientists treat ocean heat as a more reliable long-term indicator than a single year’s weather.
Warm water also affects life. Warmer layers mix less with cooler water beneath them, which changes how nutrients and oxygen move, and that links the heat story directly to the oxygen story later in this guide.
How the ocean moves carbon: the sink and the pumps
The ocean also takes in carbon dioxide from the air. The Global Carbon Budget 2022 puts the ocean CO2 sink at 2.9 ± 0.4 GtC per year during the decade 2012 to 2021, which is 26% of total CO2 emissions. Across the longer record, it says that “since 1850, the ocean has removed 26 % of total anthropogenic emissions.”
PMEL’s State of the Climate summary gives a single-year snapshot: “the ocean absorbed about 3.0 billion metric tons more carbon dioxide than it released in 2020.” The same page adds the trade-off: “more carbon dioxide stored in the ocean means less remains in the atmosphere, but also leads to increasing acidification of the waters.”
That uptake is not one process but several working together. In broad terms, carbon moves through the ocean in these ways:
- Gas exchange at the surface, where carbon dioxide dissolves into seawater.
- Chemical reactions that convert dissolved carbon dioxide into other forms of carbon in the water.
- Biological uptake, where microscopic algae turn dissolved carbon into living matter.
- Physical transport, where sinking and circulating water carry carbon below the surface.
The full picture is set out in our guide to the ocean carbon cycle. The living part of that cycle has its own guide: the biological carbon pump explains how organic matter made near the surface is exported toward deeper water.
Why phytoplankton matter
Phytoplankton are at the centre of the biological pump. NASA’s Earth Observatory describes them as “tiny, plant-like cells that turn sunlight into food,” and says they are “responsible for nearly half of the planet’s primary production.” The same page says “they still produce about half of the oxygen on Earth.”
These organisms are tiny, but their combined effect is planetary. For more on how changes in their growth could feed back on climate, see the role of phytoplankton in climate.
One caution on the numbers: the carbon budget reports its results in units of carbon, not carbon dioxide, and every estimate carries an uncertainty range. The ± 0.4 attached to the 2.9 figure is a reminder that the ocean sink is estimated from models and measurements, not read from a single meter.
Currents, upwelling and the global conveyor
Heat and carbon do not stay where they enter. The ocean circulates them through wind-driven surface currents and slower, density-driven flows that reach the seafloor. Two ideas are enough to start: upwelling, which brings deep water up, and thermohaline circulation, which sends surface water down and around the globe.
Upwelling
NOAA defines it plainly: “upwelling is a process in which deep, cold water rises toward the surface.” Wind is the usual driver: “winds blowing across the ocean surface push water away,” and water rises from below to replace it. NOAA adds that “conditions are optimal for upwelling along the coast when winds blow along the shore,” although it “occurs in the open ocean and along coastlines.”
The rising water is “cold, nutrient-rich water,” in NOAA’s description, which is why upwelling zones matter for the food web. Our explainer on what is upwelling in the ocean covers the mechanism, the regions where it is strongest and its link to fisheries and carbon. The reverse process, which NOAA calls downwelling, “also occurs when wind causes surface water to build up along a coastline and the surface water eventually sinks toward the bottom.”

The global conveyor belt
Deep circulation is driven by differences in density. NOAA says that “other, much slower currents that occur from the surface to the seafloor are driven by changes in the saltiness and ocean temperature, a process called thermohaline circulation.” In its conveyor-belt description, “cold, salty, dense water sinks at the Earth’s northern polar region and heads south along the western Atlantic basin.”
The timescale is long. NOAA’s education page says “it is estimated that it can take 1,000 years for a ‘parcel’ of water to complete the journey along the global conveyor belt.” That slowness is why the deep ocean can hold carbon and heat for a very long time. Read more in our guide to thermohaline circulation.
The Atlantic branch of this system, known as the AMOC, is a live research topic. NOAA’s Ocean Service notes that “while research shows it is weakening over the past century, whether or not it will continue to slow or stop circulating completely remains uncertain.” Treat any claim of a precise collapse date with caution: the agency itself describes the future path as uncertain.
How scientists observe the ocean
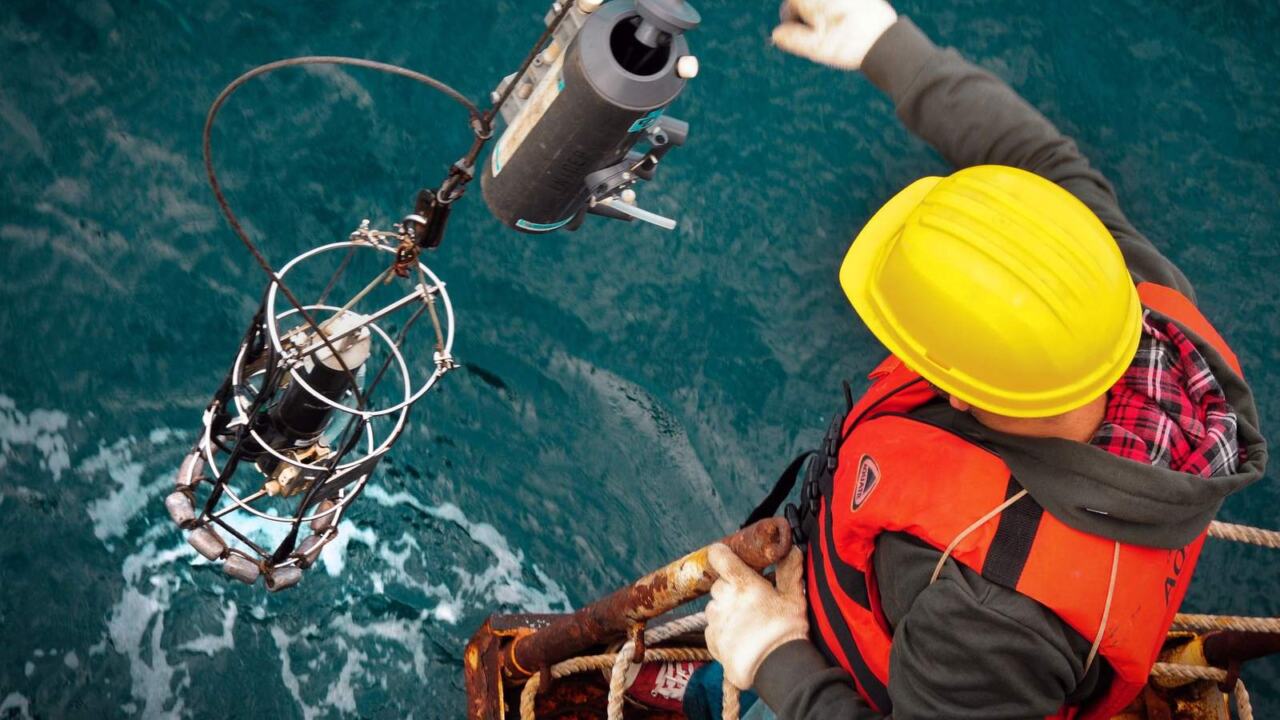
Most of the ocean is out of sight, so marine science depends on instruments. Satellites give a broad, repeated view of the surface, while ships, floats and sensors lowered or moored in the water give the detail underneath. Each method has blind spots, which is why researchers combine them.
NASA’s Earth Observatory explains why satellites became so useful: “over the past three decades, satellites have been critical for giving scientists a broad view of where and how chlorophyll-rich life is blooming in the ocean.” The instruments work because they “can detect the intensity of plant pigments-mostly chlorophyll-in the water.”
The same feature is candid about the limits. It points out that “determining what type of plankton satellites are observing-or even distinguishing plankton from other particles and dissolved substances-is tricky from space.” It also asks the obvious follow-up: “what is happening below the surface, given that satellites can only ‘see’ a few meters into the water?”
That is why a typical ocean study mixes several kinds of evidence:
- Satellite data for surface colour, temperature and the large-scale pattern of blooms.
- In-water sensors for temperature, salinity, oxygen and carbon at depth.
- Water samples measured in a laboratory to check and calibrate the sensors.
- Models that fill the gaps between measurements and test what might happen next.
Models matter most where observations are thin. The carbon budget’s ocean sink, for example, combines results from ocean models with measurement-based products, and the two approaches do not always agree on trends. When you read a headline number, it helps to know that it is usually a best estimate with a stated uncertainty, not a direct count.
Acidification and oxygen loss: two side effects
Taking up carbon dioxide and warming up both have chemical consequences. Two are now central topics in marine science: falling pH and falling oxygen. Both are changes in the water itself, not just in the climate above it.
Ocean acidification
NOAA’s education pages explain that “in the 200-plus years since the industrial revolution began, the concentration of carbon dioxide (CO2) in the atmosphere has increased due to human actions,” and that “during this time, the pH of surface ocean waters has fallen by 0.1 pH units.” Because the scale is logarithmic, NOAA says “this change represents approximately a 30 percent increase in acidity.”
The ocean is still slightly alkaline: “the ocean’s average pH is now around 8.1.” Under business-as-usual emission scenarios, NOAA says “by the end of this century the surface waters of the ocean could have a pH around 7.8,” a level last seen “during the middle Miocene, 14-17 million years ago.” Our guide to ocean acidification causes explains the chemistry step by step.
The biological effects fall mainly on shell builders. NOAA says acidification “is already impacting many ocean species, especially organisms like oysters and corals that make hard shells and skeletons by combining calcium and carbonate from seawater.” In one experiment, “when pteropod shells were placed in sea water with pH and carbonate levels projected for the year 2100, the shells slowly dissolved after 45 days.”
Ocean deoxygenation
Oxygen is the second side effect. A report by the International Union for Conservation of Nature, summarised by Woods Hole Oceanographic Institution, found that “ocean oxygen levels have dropped by 2% between 1960 and 2010, triggering an expansion of marine dead zones throughout the global ocean.”
The causes are two problems acting together. In the words of a WHOI scientist quoted in that article, “deoxygenation is caused by the combination of environmental problems: climate change from the burning of fossil fuels and nutrient loading from fertilizers and sewage.” The article adds that “as the ocean warms, it holds less oxygen and prevents mixing between the upper and lower layers of the water column, which slows circulation.”
The stakes extend to people. The same article says “the ocean is the primary source of protein for more than 1 billion people.” Our guide to ocean deoxygenation explains how low-oxygen zones form and where they are growing.

Taken together, these topics form a connected system. Warming reduces oxygen and slows mixing, carbon uptake lowers pH, and circulation sets how fast the changes spread to deeper water.
From understanding to action
Marine science is the base for the applied work that follows. Once you know how the ocean stores heat, moves carbon and responds to change, you can judge proposals for using it to help with climate problems. Our overview of ocean climate solutions sets out the main approaches and the questions to ask about each.
Energy is one well-known example. The ocean’s waves, tides and currents are a source of renewable power, and the U.S. Department of Energy has published resource estimates for them. As of the DOE’s January 2021 accomplishments report, “previous wave resource estimates were at roughly 2,600 terawatt-hours per year, and current estimates, thanks to this improved resource accounting, total 3,500 terawatt-hours per year.” Those are resource estimates for the United States, not a forecast of power that will actually be generated. Our guide to ocean renewable energy covers the technologies and their limits.
A few habits help when you read about any ocean climate claim:
- Check the unit. Carbon budgets use carbon, not carbon dioxide, and heat is measured in energy, not degrees.
- Check the period. A decade average, a single year and a long-term trend are different things.
- Check who estimated it. Government agencies, research institutions and peer-reviewed papers show their methods and uncertainty ranges.
- Look for the range. A single number without an uncertainty can hide how much is known.
Frequently asked questions
What is marine science in simple terms?
Show answer
It is the study of the ocean as a connected system of water, chemistry, life and seafloor, and of how it interacts with the atmosphere. In climate terms, it explains how the ocean stores heat, takes up carbon and circulates both.
How much of human carbon dioxide does the ocean absorb?
Show answer
Roughly a quarter. The 2022 budget edition says the ocean has removed 26 % of total anthropogenic emissions since 1850, and newer editions may revise the figure as data improve.
Does the ocean really produce half of our oxygen?
Show answer
NASA’s Earth Observatory says phytoplankton “still produce about half of the oxygen on Earth.” That is an estimate of production by marine photosynthesis, not a measure of how much oxygen sits in the air.
Is the ocean becoming acidic?
Show answer
It is becoming less alkaline. NOAA says the average surface pH is now around 8.1, which is still basic, but it has fallen by 0.1 pH units since the industrial revolution began, about a 30 percent increase in acidity.
How long does the deep ocean conveyor take to turn over?
Show answer
NOAA estimates that it can take 1,000 years for a parcel of water to complete the global conveyor belt. The Atlantic part of the system has weakened over the past century, but NOAA says its future path remains uncertain.